


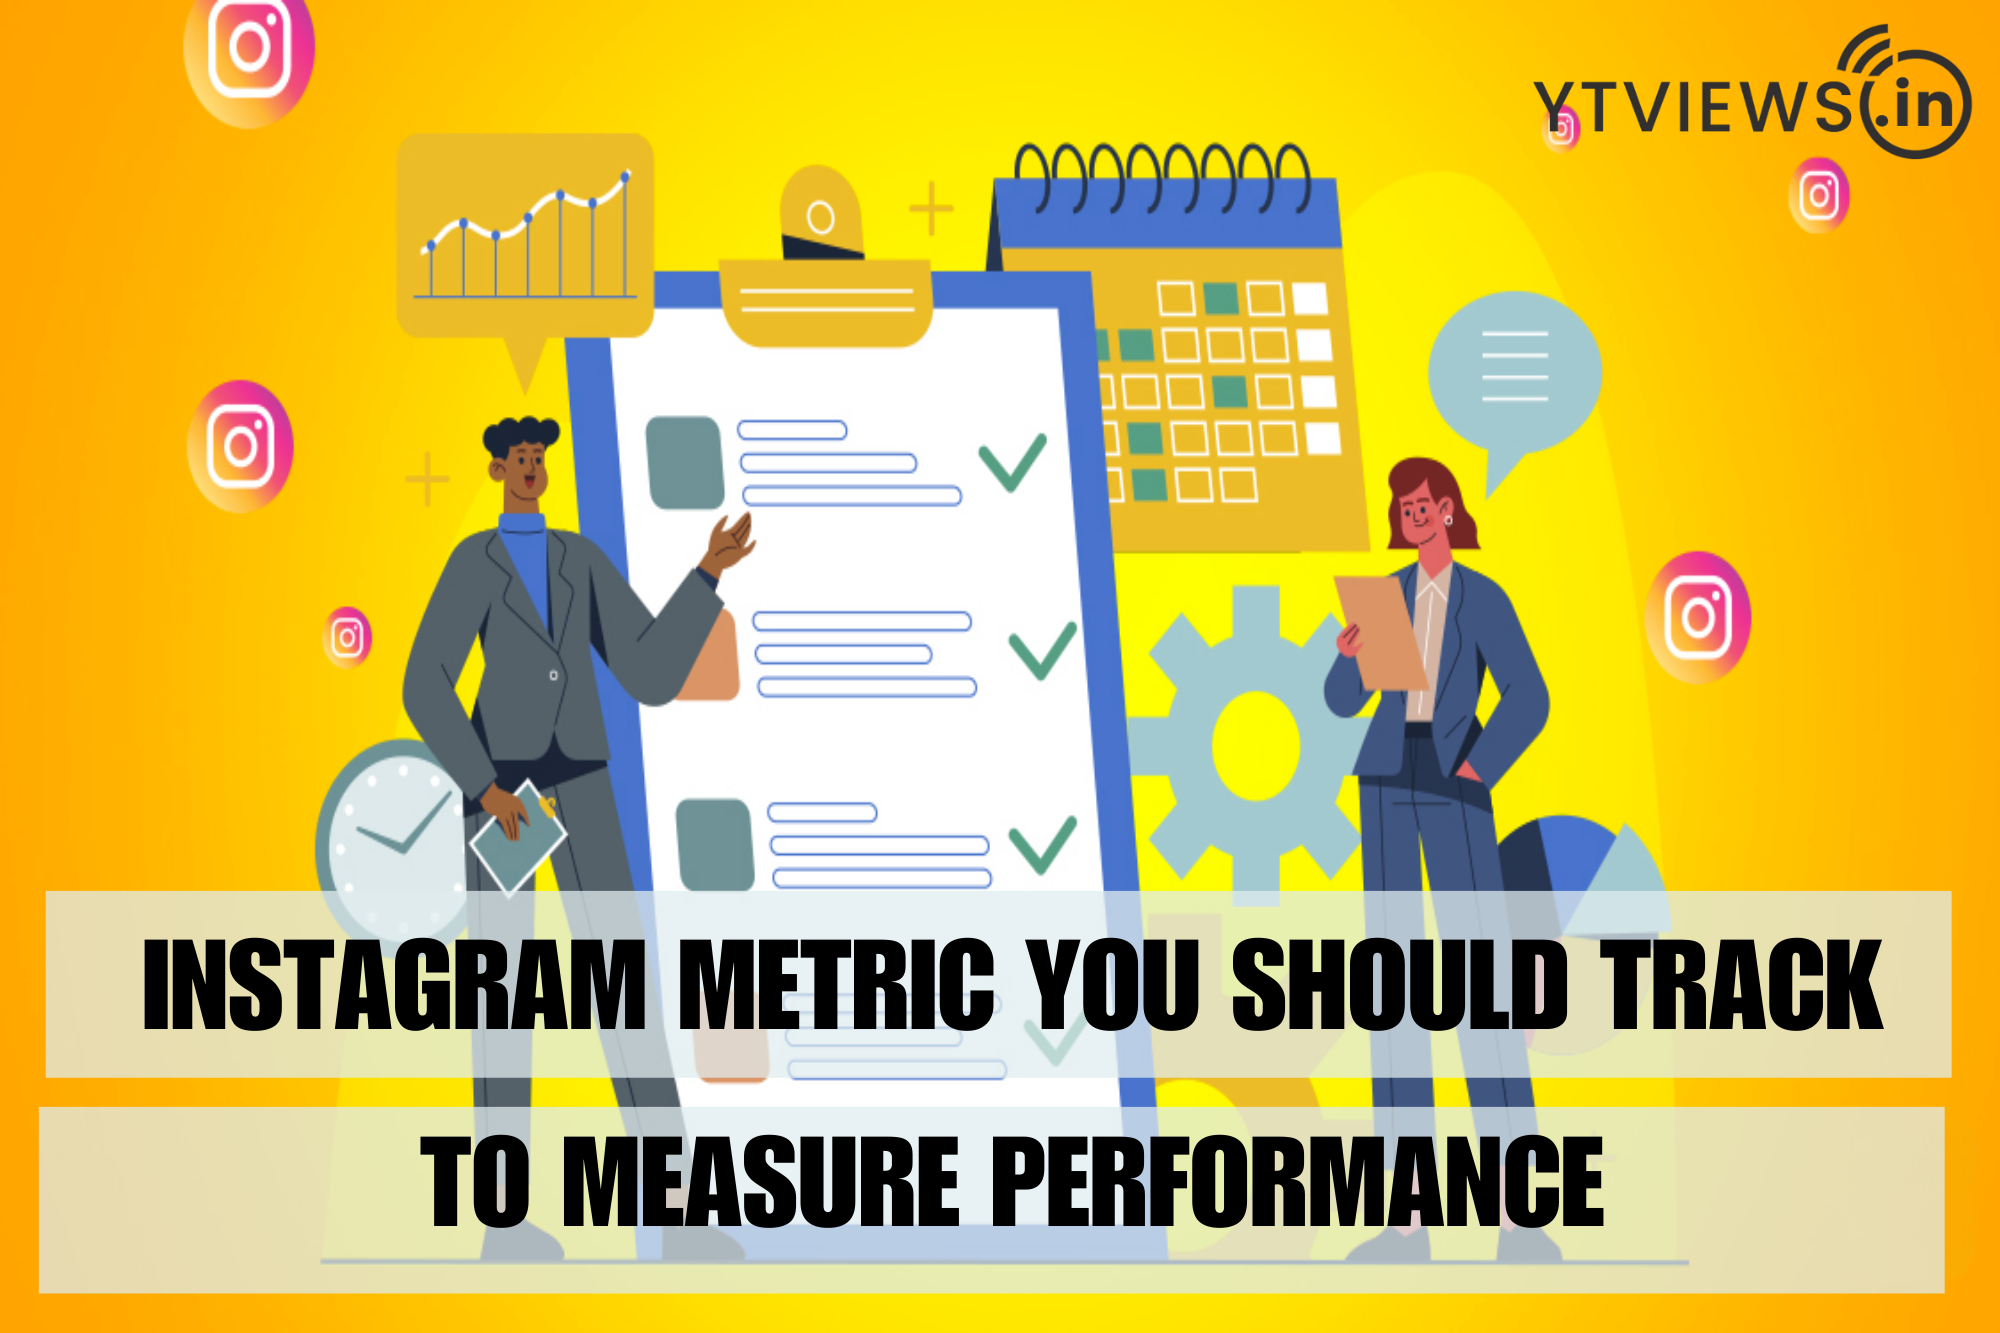
Instagram Metrics You Should Track to Measure Performance
 Tracking the most important Instagram metrics is crucial to grow your account and build an engaged following. With more than 1.3 billion active users, Instagram remains one of the largest social media platforms. It’s also one of the most powerful social media platforms for marketers when it comes to branding. Just like any other social media platform, there’s not much point in using Instagram for business if you’re not actively tracking performance and seeing results.
Whether you are evaluating an influencer’s Instagram account or tracking your own profile’s analytics, below are the most important metrics to measure the success of an account. Include these metrics in a social media report or dedicated Instagram dashboard to track how effectively your social marketing strategy is delivering results.
Follower Growth Rate
A high follower count can be an ego boost and add brand credibility, but it doesn’t necessarily say that much about the health of your marketing campaigns and Instagram strategy. Your follower growth rate, on the other hand, gives you a good idea of whether your business is expanding its reach and catching new people’s attention.
In other words, the way your follower count changes is often more important than the actual number of followers when evaluating your Instagram performance.
Engagement Per Follower
An incredible 70% of Instagram posts don’t get seen by anyone. All of the followers in the world won’t drive any new business if your followers don’t see and engage with your posts. With Instagram’s constantly updated algorithm, engagement is more important than ever to ensure your posts are seen. Tracking your engagement per follower lets you monitor just how interested your audience is. This metric is especially important if you’re evaluating a partnership with an influencer as you don’t want to pay for a sponsored post on an account without any real engagement.
Just like with follower count and growth rate, you don’t want to look at just the raw numbers. It’s important to compare the number of likes and comments with the size of the audience. You can calculate your engagement metrics on a monthly or weekly basis. Don’t try to track it on a daily basis, since normal day-to-day fluctuations will likely throw off the data. In order to calculate your engagement per follower, look at the total number of likes and comments you get during a specific time period and divide that number by the total number of followers you had during that time period.
Website Traffic
Like other social media channels, Instagram can be a powerful driver of traffic to your website. Instagram is more limiting than other social platforms in driving traffic to your site as you can’t add clickable links to each post—instead, the platform only allows a link in bio and brands over 10k followers can add swipe up links to their stories.

You can track the number of website visitors from Instagram with the help of Google Analytics, which segments your traffic into default channel groupings—one of which is “social.” If you navigate to “Acquisition” –> “Channels” and click “Social” in your GA account, you can see exactly which social channels drive traffic to your site. You can also track “Goals” in Google Analytics to see if your Instagram traffic converts, so you can accurately measure the ROI of your social media efforts.
Link Clicks
Now that you know how much traffic Instagram is driving to your site, the next step is to determine which specific links and stories were clicked?
You can take your Instagram analytics to the next level by creating URLs with UTM parameters that tell your analytics platform where a particular visitor came from. UTM parameters are basically informational tags that you append to your normal URL. UTM URLs can be unwieldy to type out manually, but there are a number of simple tools on the internet that will generate these URLs for you.
If you want to take it a step further in your reports to really impress clients and demonstrate results from Instagram, you can easily add a Google Analytics dashboard for your social traffic to AgencyAnalytics, including goal completions and goal value.
Comments Per Post
Likes on Instagram are gratifying, but comments are worth more when it comes to engagement. It only takes a second to tap the “like” button, but typing out a comment requires time and thought. When someone leaves a comment, it shows that you’ve really caught their interest and connected with them in some way.
That said, the number of comments you get is an important metric to track. Keep an eye on your average, and notice if it goes up or down. If your average number of comments has gone down, try to figure out why your audience is less engaged than they used to be. It’s also a good idea to make note of which of your individual posts get the most comments to see if a pattern emerges over time. For instance, if your audience really likes a particular type of product photo, create more posts like that to keep engagement high.
Instagram Stories Engagement
Instagram stories, which can be either videos or photos, are a bit different from regular content as they disappear after 24 hours. This disappearing act makes the feature a bit more difficult to track engagement. One way that you can track this metric is with Instagram’s native analytics tool, called Insights. Keep in mind that you’ll need a business profile on Instagram to access Insights.
There are two main metrics you should pay attention to when it comes to Stories: views and exits.
Your views tell you how many unique viewers saw your story. In general, the longer you’re on Instagram and the more followers you get, the more your story views should increase.
Your exits tell you which slide people were on when they exited your story. Exits are a good way to determine what holds your audience’s interest and what doesn’t. If you notice a lot of exits on one particular slide, try to figure out why so many people lost interest at that point.
Reach
Reach is another metric that requires you to switch to a Business Account. You can view reach within your Instagram Insights.
Reach tells you the total number of people who have seen your post. This is different from impressions. If the same person sees your post 3 times, that will count as 3 impressions. However, that person only counts as 1 towards reach, making it an important metric to measure brand awareness and how many people are actually seeing your post.
One way that you can increase your reach is with the use of hashtags and branded hashtags, although be sure to use them correctly. Along with total reach, you want to be tracking your Reach Rate. This is the percentage of followers that see your post. You can calculate it by dividing the total reach of a post by your total number of followers.
There’s no question that Instagram can be a great social media channel to market your business. It’s fun, gives you an artistic outlet, and lets you connect with your audience. Keep in mind that if you want your Instagram marketing to be profitable as well as fun, you’ve got to track the right metrics regularly. Focus on these 7 key Instagram metrics and you’ll get a clearer picture of how your current strategy is performing, as well as some ideas on how to improve.
Related Posts

Which Cities in Asia Use Instagram the Most?
Instagram Edits: Bilingual Captions & Creator Tools
YouTube Live Streaming Promotion: Complete Guide